
If you are a new joiner of a Corporate type Defined Contribution pension (Corporate type DC), it may be difficult to choose the investment products, and you may say “Is this allocation suitable for me ?”
This article will introduce the status of the asset allocation of Corporate type DC participants.
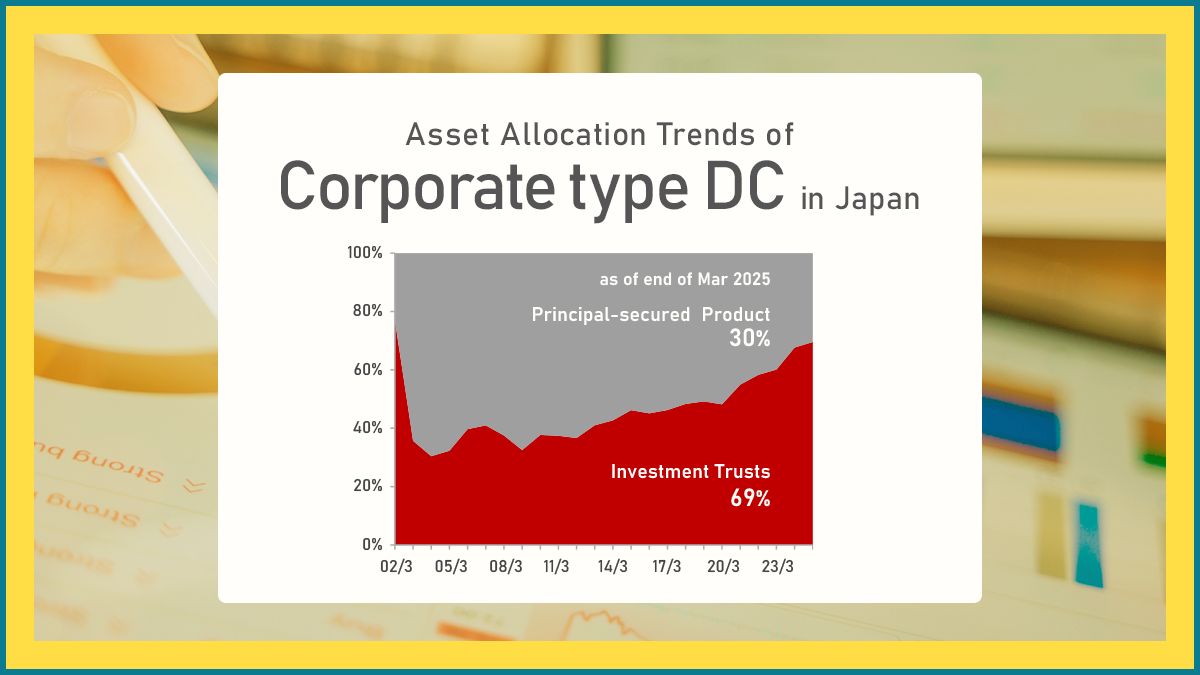
Asset Allocation of “Principal-Secured Products” and “Investment Trusts”1
As you may know, many Japanese has been conservative in investing. That’s why most of the Corporate type DC plan has “Principal-secured Products” like bank deposits in their investment lineups.The graph below shows the changes in the asset allocation (classified into principal-secured products and investment trusts 1) of Corporate type DC from the end of Mar 2002 to the end of Mar 2025. The gray area is principal-secured products, and the red area is investment trusts.As you can see, the ratio of investment trusts has gradually increased, and as of the end of March 2025, the ratio of investment trusts was 69%.

1The above investment trusts include some money trusts.
Source: Developed by Nomura Securities from “Statistical Data on Defined Contribution Pensions (End of March 2025),” DC Plan Administrators Liaison Council
Percentage of principal-secured products and investment trusts by age group
The graph below shows the percentage of principal-secured products and investment trusts in corporate DCs by age group as of the end of Mar 2025.
The percentage of investment trusts peaked in the 30s. However, there is no significant difference between the ages, and it can be seen that there is a certain amount of outstanding investment trusts.

Source: Nomura Securities based on Statistics of Defined Contribution Pensions (March 2025), DC Plan Administrators Liaison Council
In the case of iDeCo (Individual type DC), the graph below shows that the ratio of outstanding investment trusts is roughly inversely proportional to the age group.

Source: Nomura Securities based on Statistics of Defined Contribution Pensions (March 2025), DC Plan Administrators Liaison Council
Allocation among Investment Trusts
So, which assets are preferred among investment trusts? The following 2 charts show the asset allocation by category of investment trust assets of corporate type DC as of end of Mar 2005 and end of Mar 2025.
Trend
The ratio of foreign equity funds increased significantly from 2005 to 2025.The ratio of funds in categories other than balanced funds and foreign equity funds decreased.
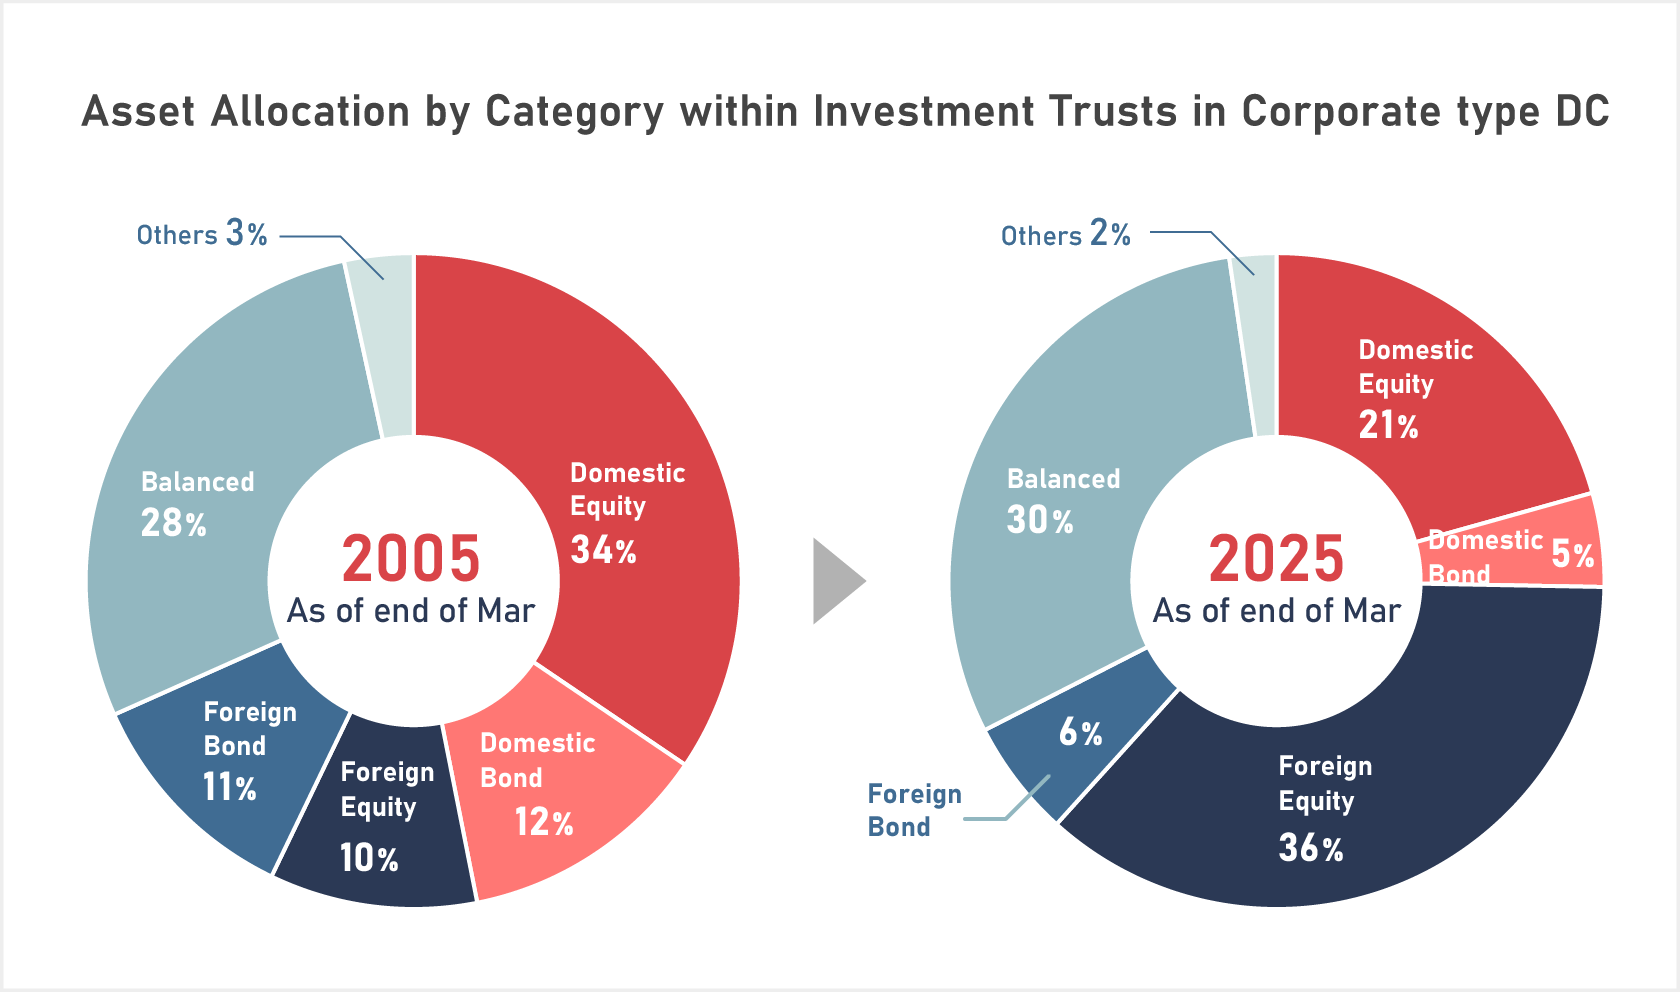
Source: Developed by Nomura Securities from “Statistical Data on Defined Contribution Pensions (March 2025),”DC Plan Administrators Liaison Council
“Active” vs “Passive”
Finally, take a look at the asset allocation status by investment method within Corporate type DC.
According to the data as of the end of March 2025, passive investment trust linked to some indexes accounted for the majority of all asset categories.
Among them, in the domestic equity asset category, the ratio of active type investment aiming at performance exceeding stock indexes was relatively large.
This may be due to the fact that in the portfolio of investment products presented in DC, there are many cases where multiple active type investment trusts are presented in the domestic equity category in Corporate type DC.
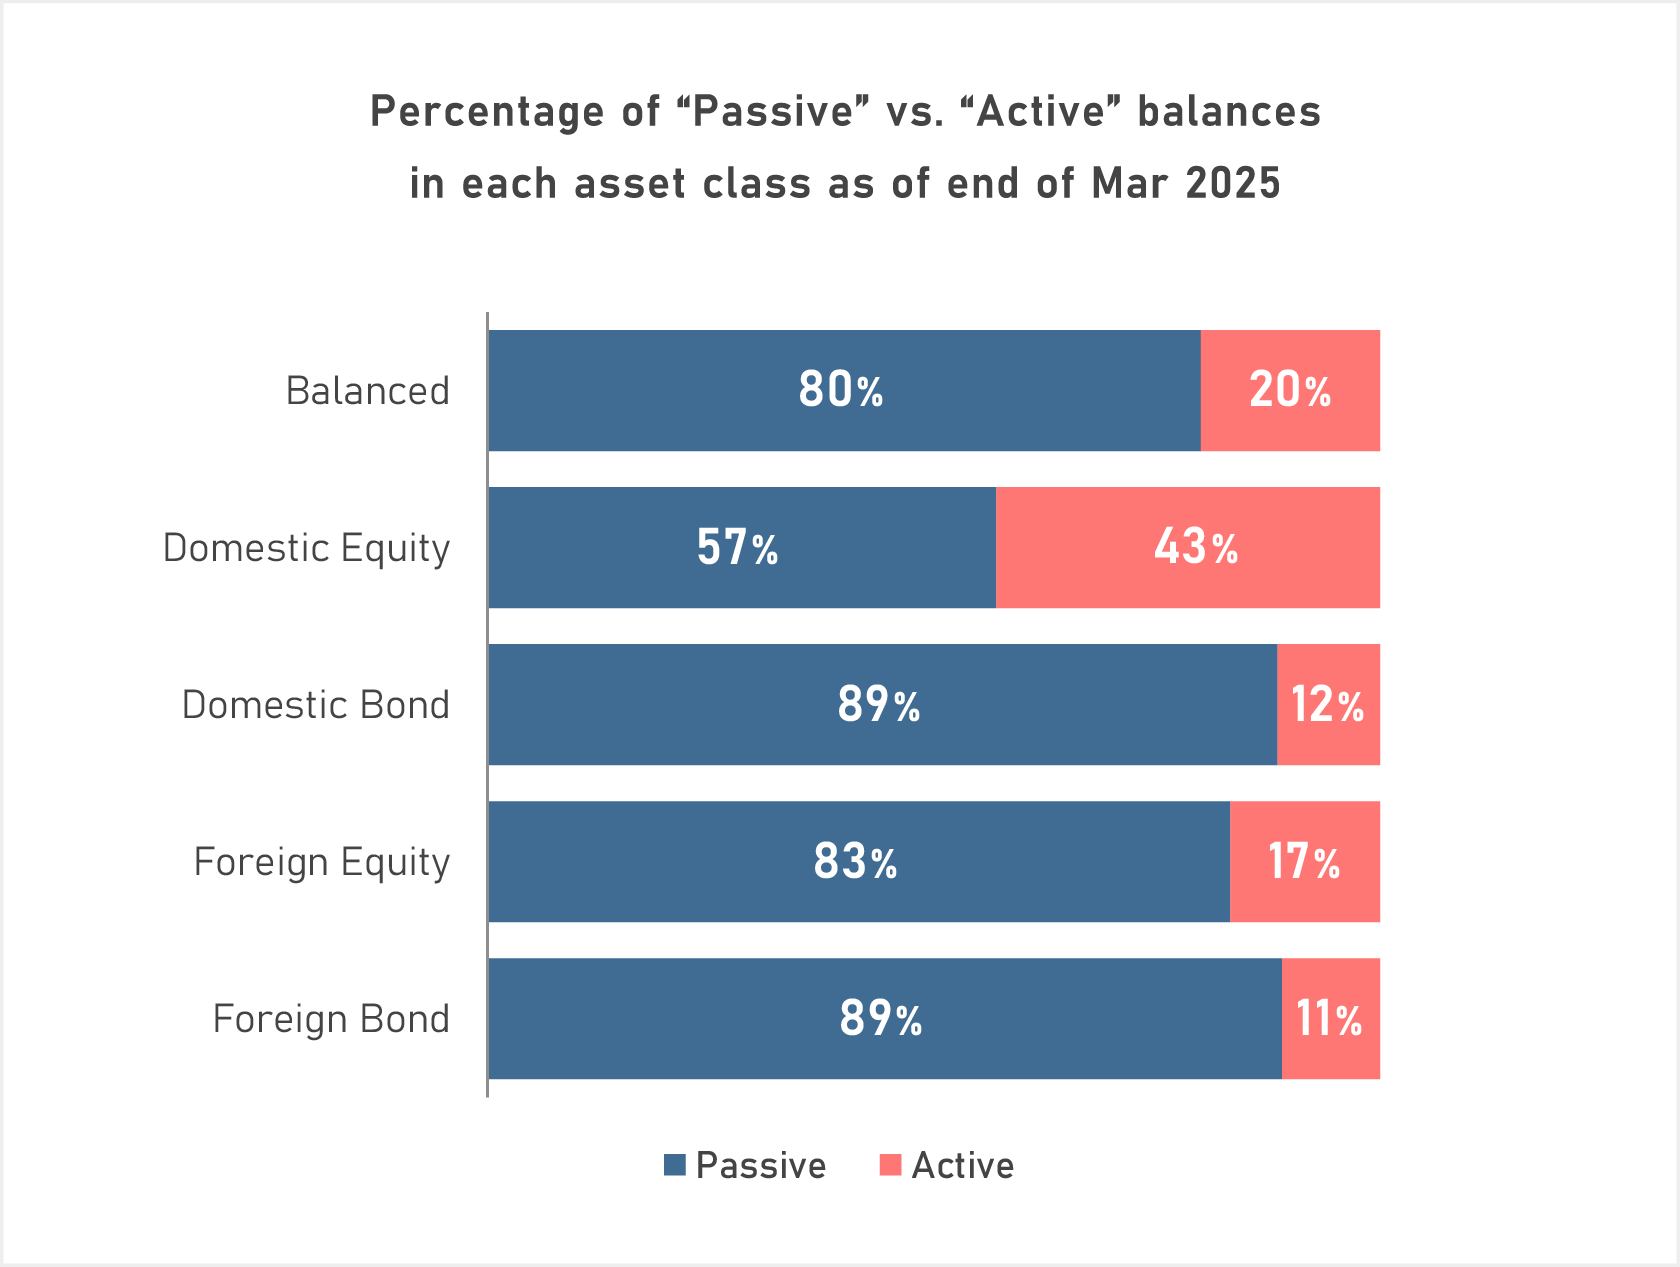
Source: Nomura Securities from “Statistical Data on Defined Contribution Pensions (as of end of Mar 2025) ”, DC Plan Administrators Liaison Council
Author: Daisuke Yabuuchi, Financial Wellbeing Department, Nomura Holdings Co., Ltd.
Published in English: January 20 , 2026
Published: March 25, 2024
This column has been prepared by Nomura Securities Co., Ltd. based on data deemed reliable as of January 2026, and is not guaranteed to be accurate or complete. It is subject to change in the future. All rights to any part of this document belong to Nomura Securities Co., Ltd., and may not be reproduced or transmitted by any means, electronic or mechanical, for any purpose without permission.
関連記事